How to Use Power BI and SharePoint Online for Retail Sales Insights
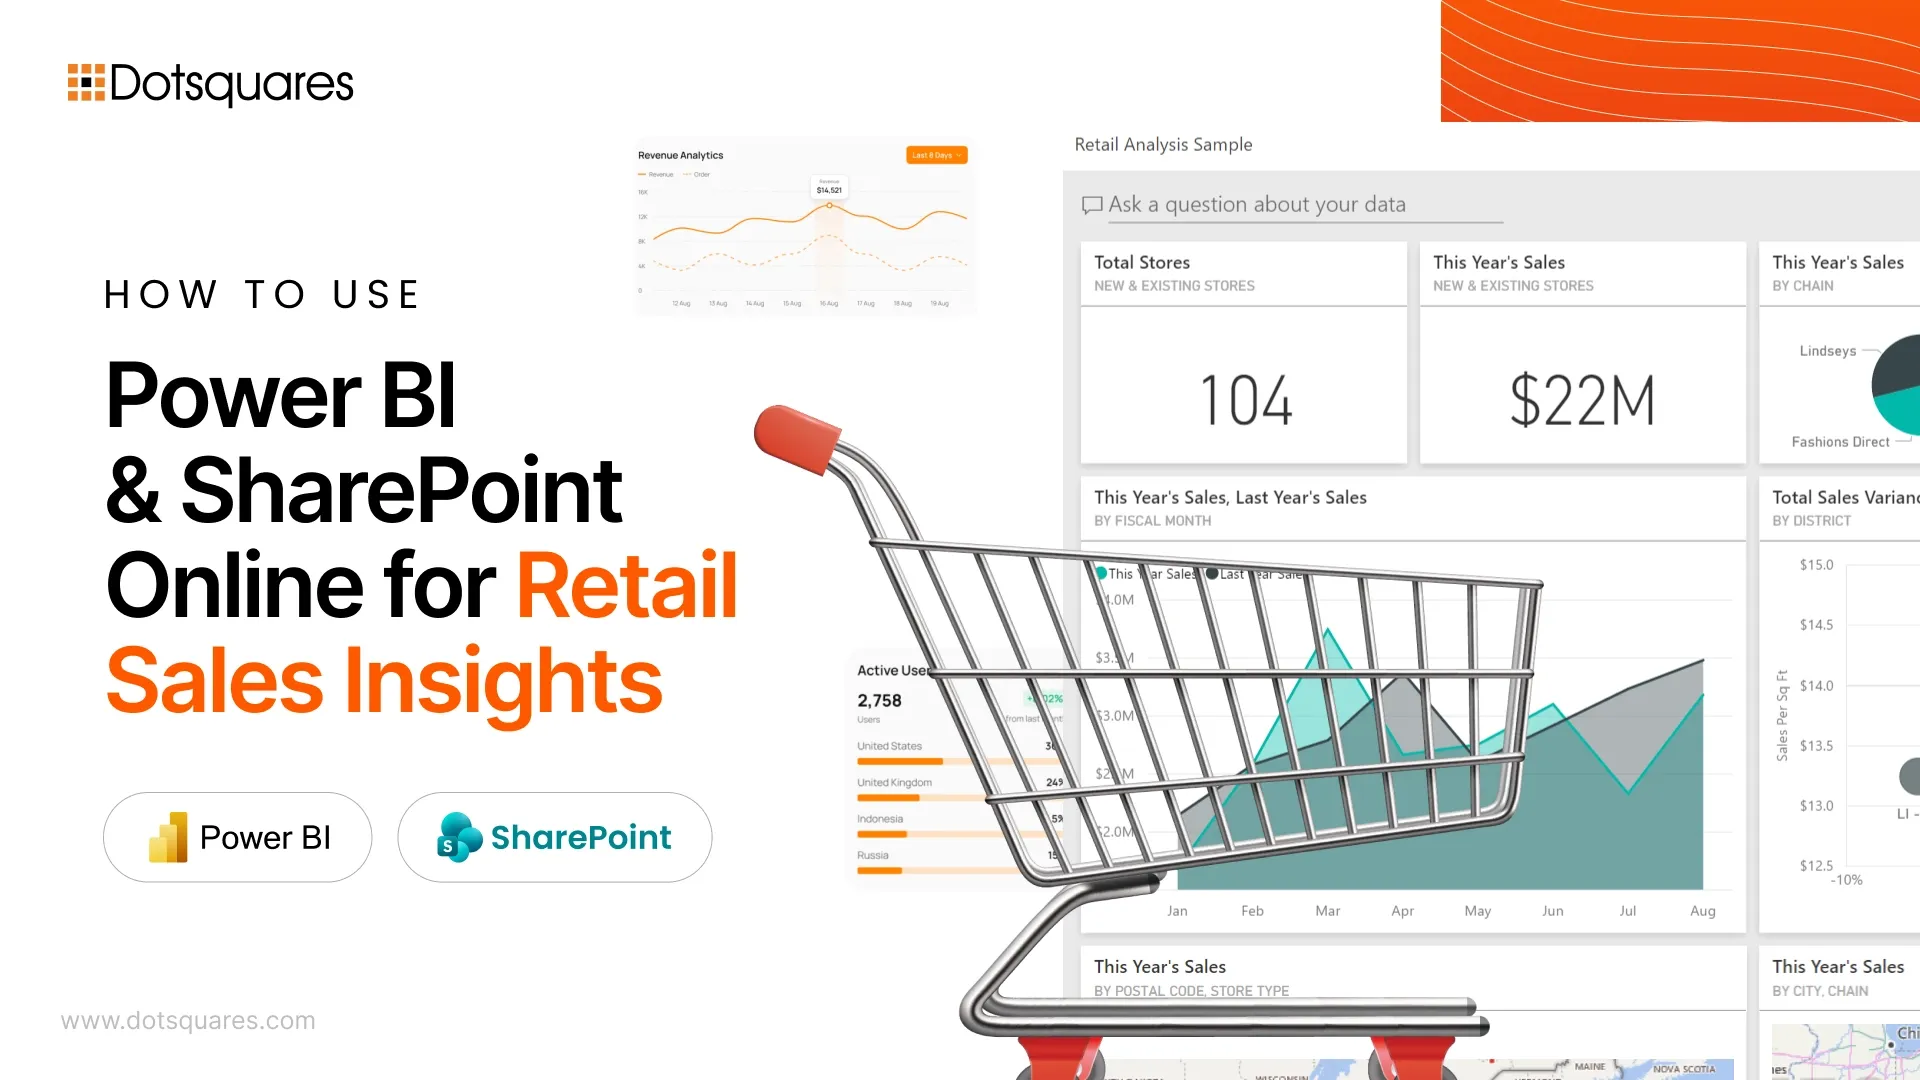
One of the biggest frustrations in running an eCommerce business in 2026 is having more data than ever, yet still struggling to find clear, useful insights.
What’s stopping most eCommerce businesses from making faster decisions? Too much data is spread across too many systems.
Sales numbers? They are in Shopify. Inventory counts? Buried in some warehouse management system. Customer clicks and cart abandons? Google Analytics. Shipping status updates? Probably spread across 12 different Excel files that someone from logistics emails you every Friday.
And when you need to make a decision about restocking or launching a sale, you are stuck piecing together information like a detective solving a cold case.
Power BI and SharePoint Online fix this problem by actually organising what you already have.
Why This Setup Makes Sense
Think about how retail data actually behaves. It does not sit nicely in one database. It explodes across platforms.
Your Shopify store tracks transactions. Your warehouse system knows what’s in stock. Google Analytics shows browsing patterns. And somewhere, there’s a spreadsheet tracking returns that nobody’s updated since October.
- SharePoint Online becomes the place where all this chaos gets organised. This same approach works beyond retail too—Power BI and SharePoint Online help education platforms bring scattered student, course, and performance data into one structured view.
- Power BI reads that data and shows you what’s actually happening. Not raw numbers, but actual patterns. It shows which products are moving, which regions are buying, and what inventory needs attention before it becomes a problem.
The bonus? If you are already paying for Microsoft 365, you already have access to both tools. No new subscriptions needed.
Get Your Data Organised First (Or Suffer Later)
Here’s where teams mess up. They get excited about building fancy charts and skip the boring part: organising their data properly.
And a few months later, they are debugging why the dashboard shows negative inventory or why last Tuesday’s sales are missing entirely.
Do this instead:
- Build separate SharePoint lists for different data, one for orders, another for inventory, and one for customer info.
- Keep your column names consistent. If you call it “ProductSKU” in one list, don’t call it “Item_Code” somewhere else.
- Use the same date format everywhere. Pick one and stick with it.
Quick Example
Let’s say you sell vintage band tees online. Your SharePoint setup might look like:
Orders List:
Order ID, Date, Customer ID, Product SKU, Quantity, Price, Shipping Status
Inventory List:
Product SKU, Current Stock, Warehouse Location, Last Restock Date
Power BI connects both. Now you can see that your Metallica shirts are selling fast while those Nirvana tees from 2023 are collecting dust in the back.
Build Dashboards People Will Actually Use
Want to know the biggest waste of time in business intelligence?
Creating a dashboard with 47 different widgets that looks amazing in a presentation but nobody ever opens again.
Start simple. Ask real questions:
- Which products made us the most money last quarter?
- What customer types spend the most?
- Do we have seasonal spikes we are missing?
- How fast is inventory moving compared to last month?
One retail team built their entire dashboard with four charts:
- Daily revenue trend (90 days)
- Top products bar chart
- Sales by region map
- Low inventory alerts
- Four charts. That’s it.
And you know what? They actually use it. Every day. Because it answers the questions they need answered without making them scroll through pages of stuff they don’t care about.
See What Customers Do Before They Buy
Sales data tells you what happened. Web analytics tells you what almost happened.
When you connect Google Analytics data to SharePoint and pull it into Power BI, you start seeing the whole story.
Example patterns you might find:
- People who view a product 3+ times before buying usually order more items
- Cart abandoners come back within 48 hours if you send them a reminder
- Customers who check reviews spend 30% more on average
This stuff stays invisible until you actually connect the dots.
Stop Guessing About Inventory
This is where the setup really pays off.
Too much stock? You have got cash sitting in boxes. Too little? You are losing sales and annoying customers.
When you combine your sales history with current inventory levels in Power BI, forecasting gets easier. You will notice:
- Certain items always spike before major holidays
- Some products sell better in specific regions
- Lead times vary by supplier and you need to order earlier for some items
Instead of ordering based on gut feeling or last year’s numbers, you are making decisions based on actual patterns.
Things That Actually Matter for Setup
Keep your SharePoint lists manageable: When a single list hits 50,000 rows, performance tanks. Archive old data to a separate library.
Add filters to your Power BI dashboards: Users need to zoom into specific weeks, product categories, or customer segments without building new reports every time.
Make it work on phones: Your warehouse manager is not opening a laptop to check inventory between deliveries. Power BI’s mobile view handles this.
How These Tools Connect
|
What It Does |
Why It Matters |
|
SharePoint Online |
One place for all your retail data instead of hunting through five different systems |
|
Power BI |
Shows you patterns in that data so you can make faster decisions |
|
Microsoft 365 Integration |
Everything works together without needing IT to build custom connections |
Why Work with Dotsquares
At Dotsquares, we build Power BI and SharePoint setups for retail businesses that need their data to actually work for them. As a leading SharePoint development agency, we specialise in SharePoint development services that connect your retail platforms seamlessly.
What we do:
- Set up your data structure properly from day one
- Build custom dashboards for your specific metrics
- Connect everything to your existing platforms (Shopify, WooCommerce, wherever)
- Stick around for support when you need adjustments
Our experienced SharePoint developers have done this enough times to know where teams get stuck and how to avoid those issues upfront.
Whether you need retail analytics setup, inventory management optimisation, or complete SharePoint development, we deliver solutions that drive real business results.

Related Post
Building an Advanced LMS with SharePoint Online, Power Apps, and Power Automate
Create a scalable LMS using SharePoint Online, Power Apps, and Power Automate. Manage training, automate workflows, and keep data secure within Microsoft 365.
Keep Reading
Power BI or Tableau: Which BI Tool Is Good for Your Business?
Compare Power BI and Tableau on cost, features, ease of use, and performance. Find the right BI tool for your business data and decision-making needs.
Keep Reading
7 Key Benefits of Sitefinity That Drive Real Business Value
Discover 7 key benefits of Sitefinity CMS, including flexibility, integrations, security, and personalization to drive real business growth and digital success.
Keep Reading