
Is Your Business AI-Ready?

Tech
 5 min read

One of the biggest frustrations in running an eCommerce business in 2026 is having more data than ever, yet still struggling to find clear, useful insights.
What’s stopping most eCommerce businesses from making faster decisions? Too much data is spread across too many systems.
Sales numbers? They are in Shopify. Inventory counts? Buried in some warehouse management system. Customer clicks and cart abandons? Google Analytics. Shipping status updates? Probably spread across 12 different Excel files that someone from logistics emails you every Friday.
And when you need to make a decision about restocking or launching a sale, you are stuck piecing together information like a detective solving a cold case.
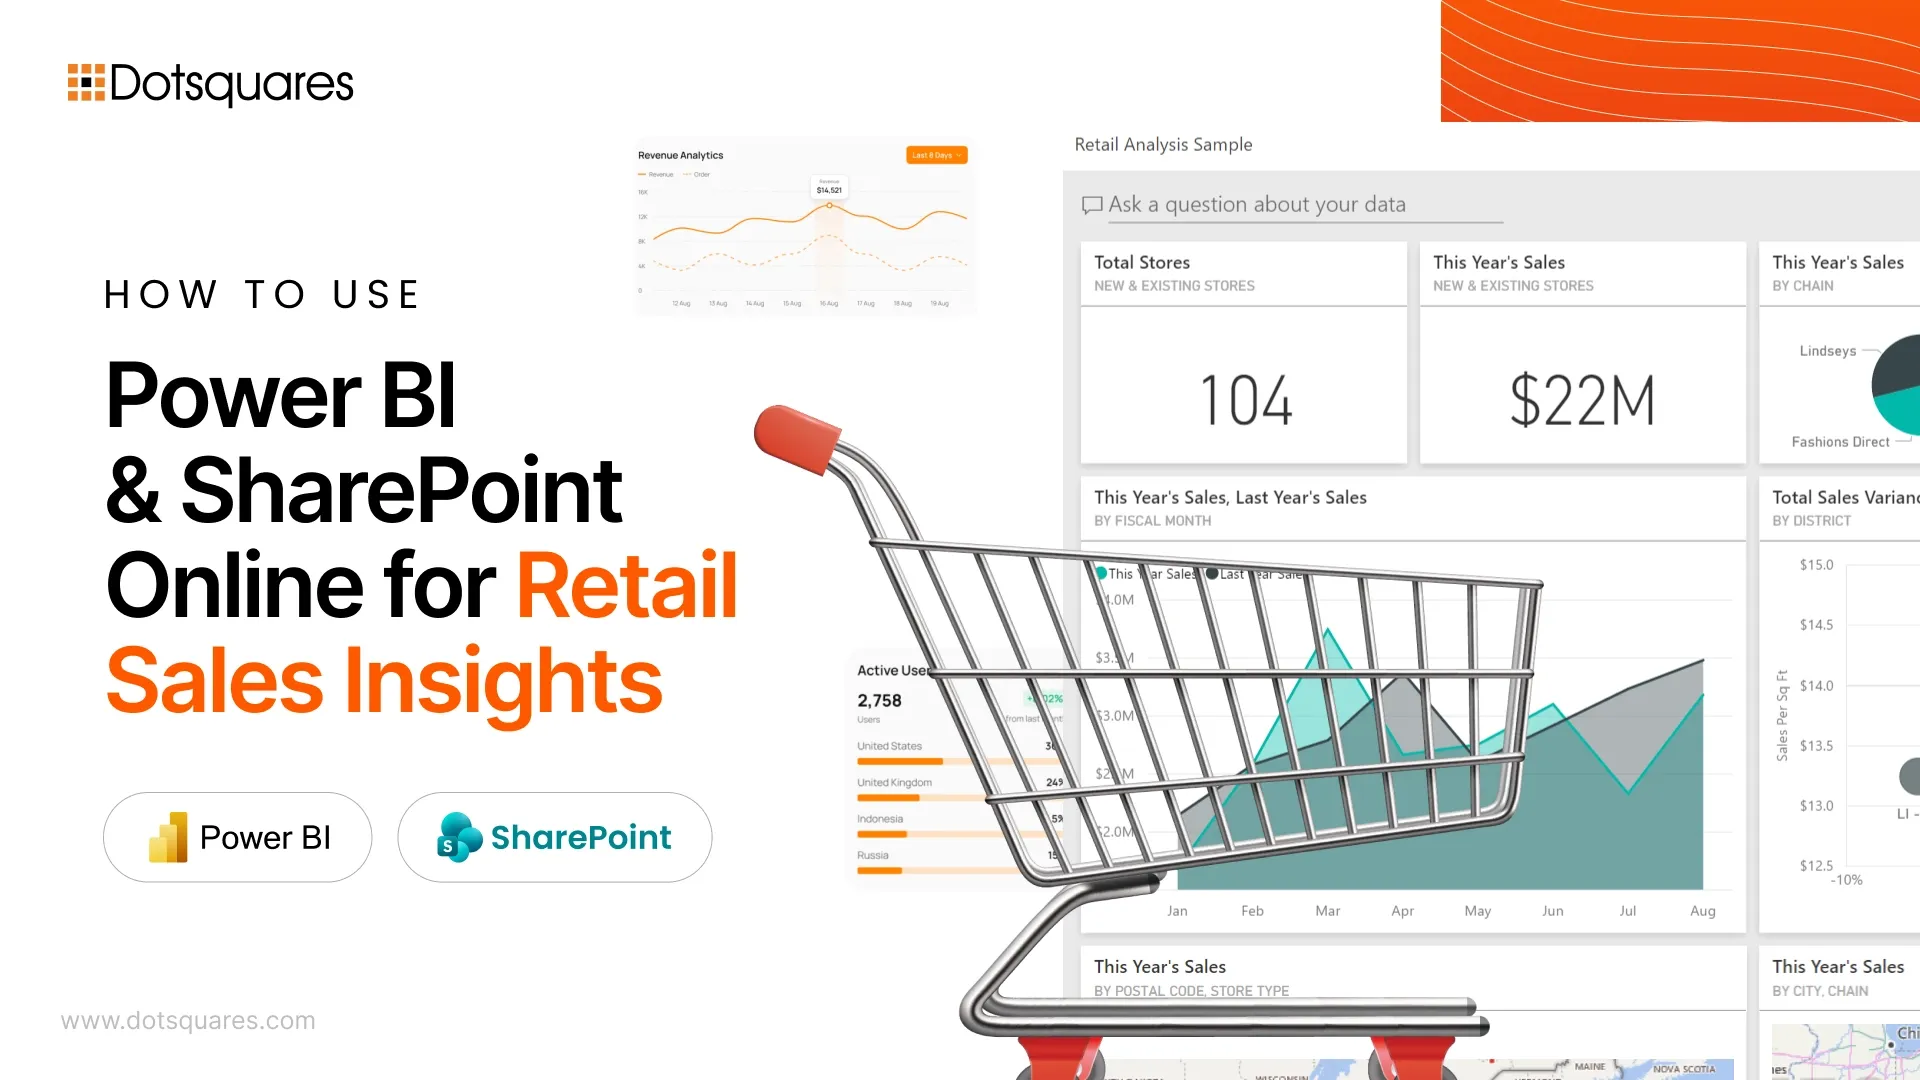
Power BI and SharePoint Online fix this problem by actually organising what you already have.
Think about how retail data actually behaves. It does not sit nicely in one database. It explodes across platforms.
Your Shopify store tracks transactions. Your warehouse system knows what’s in stock. Google Analytics shows browsing patterns. And somewhere, there’s a spreadsheet tracking returns that nobody’s updated since October.
The bonus? If you are already paying for Microsoft 365, you already have access to both tools. No new subscriptions needed.
Here’s where teams mess up. They get excited about building fancy charts and skip the boring part: organising their data properly.
And a few months later, they are debugging why the dashboard shows negative inventory or why last Tuesday’s sales are missing entirely.
Let’s say you sell vintage band tees online. Your SharePoint setup might look like:
Orders List:
Order ID, Date, Customer ID, Product SKU, Quantity, Price, Shipping Status
Inventory List:
Product SKU, Current Stock, Warehouse Location, Last Restock Date
Power BI connects both. Now you can see that your Metallica shirts are selling fast while those Nirvana tees from 2023 are collecting dust in the back.
Want to know the biggest waste of time in business intelligence?
Creating a dashboard with 47 different widgets that looks amazing in a presentation but nobody ever opens again.
Start simple. Ask real questions:
One retail team built their entire dashboard with four charts:
And you know what? They actually use it. Every day. Because it answers the questions they need answered without making them scroll through pages of stuff they don’t care about.
Sales data tells you what happened. Web analytics tells you what almost happened.
When you connect Google Analytics data to SharePoint and pull it into Power BI, you start seeing the whole story.
Example patterns you might find:
This stuff stays invisible until you actually connect the dots.
This is where the setup really pays off.
Too much stock? You have got cash sitting in boxes. Too little? You are losing sales and annoying customers.
When you combine your sales history with current inventory levels in Power BI, forecasting gets easier. You will notice:
Instead of ordering based on gut feeling or last year’s numbers, you are making decisions based on actual patterns.
Keep your SharePoint lists manageable: When a single list hits 50,000 rows, performance tanks. Archive old data to a separate library.
Add filters to your Power BI dashboards: Users need to zoom into specific weeks, product categories, or customer segments without building new reports every time.
Make it work on phones: Your warehouse manager is not opening a laptop to check inventory between deliveries. Power BI’s mobile view handles this.
|
What It Does |
Why It Matters |
|
SharePoint Online |
One place for all your retail data instead of hunting through five different systems |
|
Power BI |
Shows you patterns in that data so you can make faster decisions |
|
Microsoft 365 Integration |
Everything works together without needing IT to build custom connections |
At Dotsquares, we build Power BI and SharePoint setups for retail businesses that need their data to actually work for them. As a leading SharePoint development agency, we specialise in SharePoint development services that connect your retail platforms seamlessly.
What we do:
Our experienced SharePoint developers have done this enough times to know where teams get stuck and how to avoid those issues upfront.
Whether you need retail analytics setup, inventory management optimisation, or complete SharePoint development, we deliver solutions that drive real business results.

Discover how DevOps deployment automation, CI/CD pipelines, and Infrastructure as Code help businesses reduce software deployment time by up to 80% while improving quality and reliability.
Keep Reading
Discover the top reasons AI implementation fails and learn seven common mistakes businesses should avoid to improve adoption, ROI, and long-term AI success.
Keep Reading
Explore the Lovable Pricing Guide 2026 with detailed plan comparisons, pricing, pros, cons, features, and the best alternatives.
Keep Reading