Power BI Development Services
 Custom Dashboard & Report Development
 Power BI Embedded & Application Integration
 Data Modelling, DAX & Semantic Layer Design
 Power BI Gateway & Data Source Configuration
 Workspace Governance & Tenant Administration
 Report Migration, Audit & Performance Optimisation


Partnered with Startups and Fortune 500


Recognised For Excellence as Power BI Development Company
Dotsquares is a Microsoft Gold Partner with a dedicated Power BI practice that's delivered reports, dashboards, semantic models, and embedded analytics for businesses across the UK, US, Australia, India, and beyond. We work with businesses that are starting from scratch with Power BI, those that have invested in the platform but aren't getting the value they expected from it, and those that need specialist support on specific problems — a slow report, a complex DAX requirement, a governance question, or an embedded analytics integration. Whatever stage you're at with Power BI, we've seen it before.
Our Power BI Consulting Services
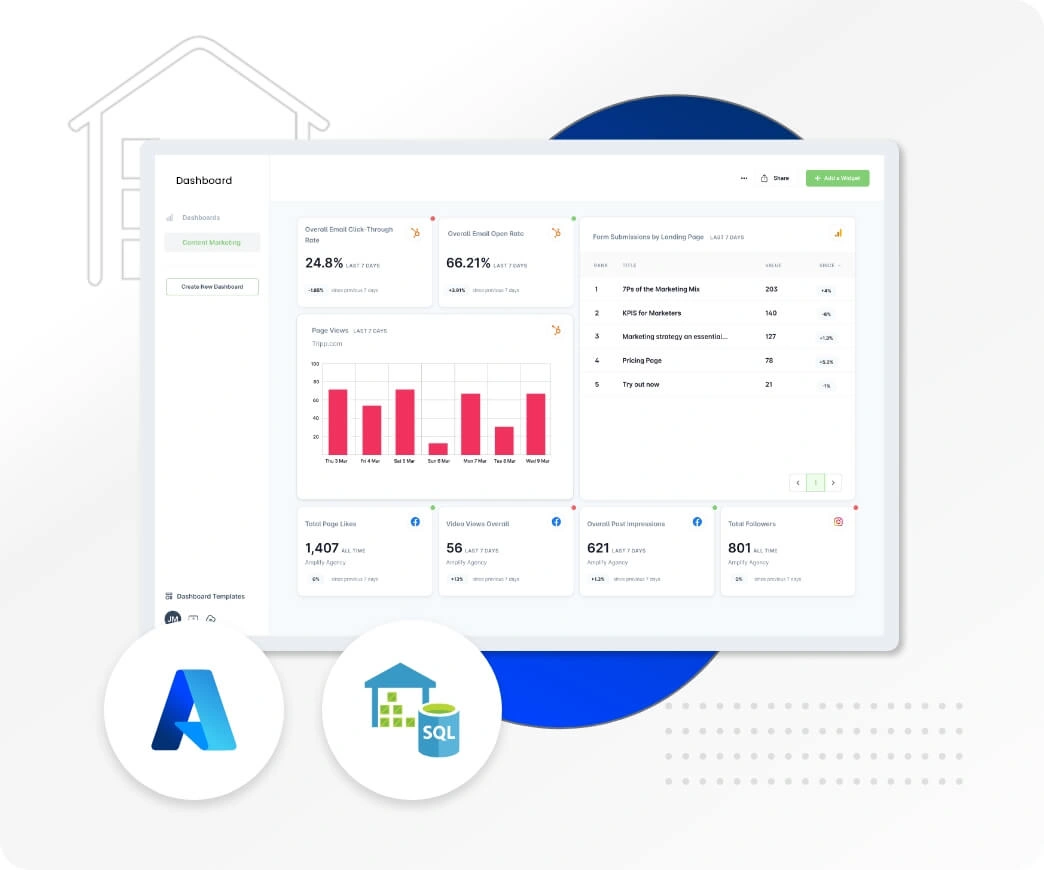
A Power BI dashboard that's genuinely useful looks very different from one that just has charts on it. The useful one shows the right information to the right person, at the right level of detail, in a way that doesn't require a training session to navigate. We build reports and dashboards from the ground up — starting with what decisions the report needs to support and who's making them, rather than starting with whatever data is available and seeing what charts we can make from it.

Most Power BI performance problems, calculation errors, and report inconsistencies trace back to the data model. A star schema built with the right table relationships, the right grain, and measures written in clean DAX will outperform a flat table imported from Excel every time — both in speed and in the reliability of the numbers it produces. We design and build proper semantic models, whether inside Power BI Desktop or in Analysis Services / Azure Analysis Services for larger-scale deployments.
Microsoft Fabric integration with Power BI unifies your data estate by bringing together data engineering, data warehousing, real-time analytics, and business intelligence into a single SaaS platform. We help you leverage Fabric's OneLake architecture to centralize data from multiple sources, build unified semantic models, and deliver Power BI reports that draw from a single source of truth — eliminating data silos and reducing infrastructure complexity across your analytics stack.
Multi-tenant environments, regional sales teams, and customer-facing analytics all require data visibility controls that restrict what each user can see based on their role or organizational hierarchy. We implement row-level security (RLS) in Power BI using dynamic DAX filters, role definitions, and Azure AD integration — ensuring users only access the data they're authorized to view while maintaining a single shared dataset and report structure that scales efficiently across thousands of users without duplicating content.
Power BI environments that have grown organically tend to develop problems — reports duplicated across multiple workspaces, no clear ownership of published content, sensitivity labels applied inconsistently, and admin settings that haven't been reviewed since the tenant was set up. We work with businesses to establish a governance framework that's proportionate to the size of their Power BI deployment, without creating so much process overhead that people stop using the platform.
A Power BI report that takes 30 seconds to load rarely gets used. Slow reports are usually the result of data model problems — too many rows in the wrong table, DAX measures that trigger full table scans, relationships that Power BI has to work hard to resolve — rather than Power BI itself being slow. We diagnose slow reports using DAX Studio and Performance Analyzer, find the specific bottlenecks, and fix them — without having to rebuild the whole report from scratch in most cases.
If your business is moving reports from Excel, SSRS, Tableau, Qlik, or another legacy BI tool to Power BI, we handle the migration properly — not just recreating the old reports in a new tool, but using the opportunity to improve them where the original design had limitations. For businesses with Power BI environments that have grown into an unmanageable number of workspaces and reports, we also handle consolidation and rationalisation projects.
A Power BI deployment that only one person in the business can maintain is a business risk. We run structured training programmes for report authors, data modellers, and administrators — tailored to the specific version of Power BI your business uses, the data sources you connect to, and the level the participants are starting from. We also build internal documentation and governance guides that your team can use as a reference after training is done.
Power BI isn't a deploy-once-and-forget platform. New data sources need connecting, existing reports need updating when upstream data models change, performance issues emerge as data volumes grow, and Microsoft releases updates that occasionally change how things work. Our managed support service keeps your Power BI environment maintained, your users supported, and your content current — so the reporting capability your business depends on doesn't quietly degrade over time.
Let’s Turn Your Data Into Opportunities!

Our Technological Expertise in Data Engineering
Businesses struggle to maximize tech investments in today's fast-changing environment. Our 20+ years of experience can help you get the most out of your technology. We offer flexible solutions that adapt to your evolving needs.


 Azure Data Factory
Streamline your data workflows across Azure services effortlessly with Azure Data Factory. Optimize operations and gain insights faster than ever before.
Learn More
 Databricks
Drive innovation with advanced analytics and AI using Databricks. Accelerate data-driven decisions and unlock new opportunities for growth and efficiency.
Learn More
 Snowflake
Supercharge your data storage and processing with Snowflake. Our solutions deliver lightning-fast insights that empower quick and informed decision-making.
Learn More
 Business Intelligence & Power BI
Data engineering is the process of designing, building, and maintaining data infrastructure to support data-driven decision-making and business operations.
Learn MoreHire BI Developers & Data Engineers
Our Power BI and Microsoft BI team covers the full range of specialisms that a production Power BI deployment needs:

Data Modeling Expert
Our data modeling specialists design optimized star schemas, snowflake models, and dimensional structures tailored to your business logic and reporting requirements. We build efficient relationships, implement role-playing dimensions, and ensure your Power BI data models deliver fast query performance even with millions of rows — transforming raw data into analytically rich, query-ready structures.

Data Analytics Professional
Our data analytics experts transform complex datasets into actionable insights through advanced statistical analysis, trend identification, and predictive modeling. We apply analytical techniques including cohort analysis, customer segmentation, forecasting, and KPI benchmarking to uncover patterns in your data — then visualize those findings in Power BI dashboards that make sophisticated analytics accessible to business users across your organization.

DAX Optimization Expert
Performance bottlenecks in Power BI often trace back to inefficient DAX formulas. Our DAX specialists write optimized measures, calculated tables, and time intelligence functions that reduce query execution time and improve dashboard responsiveness. We refactor complex calculations, eliminate unnecessary iterations, leverage variables and filter context effectively, and ensure your reports scale smoothly as data volumes grow.

DataOps Engineer
Power BI deployment at scale requires automation, version control, and continuous integration practices. Our DataOps engineers implement deployment pipelines, automate dataset refresh orchestration using Azure DevOps or GitHub Actions, manage .pbix file versioning, and configure environment-specific parameters — making your Power BI development process repeatable, auditable, and production-ready across dev, test, and live workspaces.
Why Choose Dotsquares for Data Engineering Services?
With a team of over 1,000+ experts combined with their exclusive experience, we offer comprehensive data analytics engineering services to help businesses make informed, data-driven decisions.
Transform your enterprise data into actionable insights with Dotsquares, your trusted partner in data engineering.
Connect with Us!


Advantages of Hiring Developers from Dotsquares

ISO 27001 Certified Security
We maintain the highest international standards for data protection with ISO 27001:2022 certification, ensuring your intellectual property and sensitive information remain 100% secure.

1000+ In-House Developers
Our team of 1,000+ in-house experts is recruited through a rigorous screening process, selecting only the top technical talent to ensure premium quality for every project.

24+ Years of Proven Excellence
With over 27,000+ successful projects delivered since 2002, we bring deep industry experience and a stable, reliable foundation to every partnership we build.

Trusted Global Technology Partners
We are proud Microsoft Gold, AWS, and Salesforce Consulting partners, ensuring your solutions are built using the latest enterprise-grade technologies.
What We Have Done
Explore some of our PHP web development projects demonstrating our expertise in harnessing PHP to create robust and scalable solutions.

Data Engineering Solution
Ivy Enterprise
 Challenges
Managing diverse sales data sources efficiently and selecting the right analytics tools were key challenges.
 Solution
To address these challenges, we automated data collection with Power BI, implemented effective data visualization, and used Azure Functions for real-time data extraction. Microsoft Azure Power BI provided robust analytics, enhancing decision-making across the client's restaurant enterprises.
- TECHNOLOGY Azure
- Region UK
Building Production-Ready Data
Infrastructure withScalable Pipelines
Enterprise Architecture
Real-Time Processing
We develop automated data pipelines that eliminate the mundane task of data work, reduce errors, and ensure seamless flow of data from source systems to analytics systems. Our engineering methodology includes ingestion, transformation, validation, and orchestration, ensuring that your teams receive data on time and without the hassle of pipeline failures.
- Real-time data ingestion
- ETL/ELT automation
- Data quality monitoring
- Scalable processing workflows

Unify raw data into a reliable base for business intelligence and machine learning. We build and implement data warehouses, lakehouse solutions, and analytics infrastructure that can scale with your query workloads, integrate with your BI tools, and deliver your data teams the performance they need without constant tuning.
- Cloud data warehouse setup
- Data modeling & optimization
- BI tool integration
- Query performance tuning

Whether you're starting from scratch or modernizing legacy infrastructure, we help you design a data architecture that matches your actual requirements — not a trendy stack that looks good on paper. We assess your data sources, user needs, and growth trajectory, then build or restructure your infrastructure accordingly.
- Data architecture design
- Cloud data migration planning
- Technology stack evaluation
- Roadmap & implementation

Tailored Technologies to Conquer Your Development Challenges
Harness the power of our advanced technologies to elevate user interaction and drive engagement.


The Advantages of Working with Dotsquares for Development
We don't just build websites - we craft solutions that transform your business. Here's what sets us apart:

Clear Communication
We believe in total transparency. You'll get regular updates on your project's progress, and your feedback is always welcome. Plus, you'll always own all the code and creative elements we create for you.

On-Time Delivery
We use cutting-edge project management tools and agile development practices to keep your project on track. This means you'll get a high-qualitdeliveryed exactly when you expect it.

Solutions Built for Your Needs
Whether you need a custom-built or strategic optimisation of an existing one, we prioritise your unique goals. We'll ensure your development perfectly aligns with your digital strategy.

Direct Collaboration
Consider our team an extension of yours! You'll have direct access to the talented developers and designers working on your project during agreed-upon hours, ensuring smooth collaboration.

Elevated User Experience
Our creative and skilled UI/UX designers and developers leverage the latest technologies to deliver user-friendly, scalable, and secure development that drive results and meet your evolving business needs.

Flexible Engagement Models
We understand that your needs can change. That's why we offer flexible engagement options. Choose the model that works best for you now, and switch seamlessly if your needs evolve. We're committed to building a long-term, reliable partnership with you.
Get Our Assistance for Your Business Needs
At Dotsquares, we provide flexible options for accessing our developers' time, allowing you to choose the duration and frequency of their availability based on your specific requirements.

 Bucket hours
When you buy bucket hours, you purchase a set number of hours upfront.
- Your purchased bucket hours remain valid for 6 months, during this time frame, you can utilize our services until your hours are exhausted or until the 6-month period expires.
- For example, if you invest in 40 bucket hours and use 10 hours within the first month, you will have a remaining 30 hours to utilize over the next 5 months.
- In this case, the developer will work for other projects simultaneously as you have opted for bucket hours and not dedicated hiring.
It's a convenient and efficient way to manage your developer needs on your schedule.
Explore more


 Dedicated/Regular Hiring
In dedicated hiring, the number of hours are not fixed like the bucket hours but instead, you are reserving the developer exclusively for your project.
- The developer will work only on your project for a set amount of time.
- You can choose to hire the developer for a week or a month, depending on what your project needs.
- This means our developer will focus exclusively on meeting the needs of your project, without any distractions from other commitments.
Whether you need help for a short time or a longer period, our dedicated hiring option ensures your project gets the attention it deserves.
Explore moreOur Power BI Development Process
Companies work with us because we've mastered the craft of turning raw business data into decision-making tools that people actually use. Our Power BI development process is built around understanding what your teams need to see, how they need to see it, and what actions those insights should drive.
Planning & Consultation
We start by mapping out your reporting requirements, data sources, and the business questions your dashboards need to answer. This isn't a generic discovery call — we dig into which datasets matter, who needs access to what, and what decisions will be made based on the reports we're building.
Identify all relevant data sources — ERP systems, CRMs, databases, spreadsheets, cloud apps — and document which business metrics and KPIs need to be tracked.
Work with stakeholders to outline the structure of each dashboard, determining what visualizations tell the story most effectively and what drill-down capabilities are needed.
Define who needs access to which reports, what level of data visibility each role requires, and how row-level security will be implemented to protect sensitive information.
Build a phased delivery schedule with clear checkpoints like data model validation, dashboard design review, UAT sessions — so progress stays visible and on track.
Design
Our designers and BI specialists create dashboard mockups that prioritize clarity and usability. Power BI reports can get cluttered quickly, so we focus on visual hierarchy, logical layout, and making sure the most important metrics stand out without overwhelming users.
Design the layout of each report page with attention to how users will scan the information — top-level KPIs first, supporting details below, interactive filters placed logically.
Choose the right chart types for each metric — bar charts for comparisons, line graphs for trends, tables for detailed breakdowns — avoiding unnecessary visual complexity.
Apply your brand colors, fonts, and design standards across all dashboards to ensure reports feel like a natural extension of your business environment.
Build working prototypes in Power BI Desktop for stakeholder review, allowing teams to interact with sample data and provide feedback before full development begins.
Development
Our Power BI developers build out the data models, write DAX measures, connect live data sources, and construct the final dashboards. We keep you in the loop with regular progress updates and working versions you can test as development moves forward.
Build optimized data models in Power BI with proper relationships, calculated columns, and measures that support fast, accurate reporting at scale.
Write custom DAX formulas to calculate complex business metrics, time intelligence comparisons, and KPIs that can't be derived from raw data alone.
Set up Power BI gateways to connect to on-premises data sources, configure scheduled refreshes, and ensure dashboards always reflect current information.
Add slicers, drill-throughs, bookmarks, and cross-filtering capabilities so users can explore data dynamically and find the insights relevant to their role.
Testing
Before any dashboard goes live, we run thorough testing to confirm data accuracy, validate calculations, check performance under realistic data loads, and ensure reports render correctly across devices and browsers.
Cross-check all calculations, measures, and visualizations against source data to ensure every figure displayed is accurate and audit-ready.
Test dashboard performance with production-scale datasets to identify slow-loading visuals, optimize query logic, and ensure acceptable response times.
Conduct structured testing sessions with actual end users, gathering feedback on usability, layout, and whether the dashboards answer the business questions they're meant to solve.
Verify that reports display correctly on desktop, tablet, and mobile, and work seamlessly across different browsers and the Power BI mobile app.
Deployment
Once testing is complete and stakeholders have signed off, we deploy the dashboards to the Power BI Service, configure workspace access, set up distribution channels, and ensure everything is ready for your teams to start using.
Publish reports to the appropriate Power BI workspaces with proper licensing, capacity allocation, and workspace role assignments configured.
Grant access to the right users and groups, apply row-level security rules to restrict sensitive data, and configure sharing permissions based on organizational roles.
Finalize refresh schedules for all datasets, set up alerts for failed refreshes, and configure any required email subscriptions or automated report distribution.
Provide user training sessions to demonstrate how to navigate dashboards, apply filters, export data, and make the most of the interactive features built into each report.
Maintenance
Power BI environments evolve — new data sources get added, business requirements shift, and performance needs tuning as usage grows. We provide ongoing support to keep your dashboards accurate, fast, and aligned with changing business needs.
Add new data sources, expand existing models, introduce additional KPIs, and refine DAX logic as business reporting requirements evolve.
Track dashboard usage, identify slow-loading reports, optimize data models and queries, and fine-tune refresh schedules to maintain responsiveness.
Address any data discrepancies, broken visuals, or refresh failures that arise, ensuring uninterrupted access to accurate business intelligence.
Roll out new dashboard pages, add advanced analytics features, integrate AI visuals, and continuously improve reports based on user feedback and changing priorities.
Still not sure what you are looking for?
Talk to Our Experts
Built Relationships with 12,500+ Happy Clients!
Companies employ software developers from us because we have a proven track record of delivering high-quality projects on time.

5+ Years of Average Experience

Integrity & Transparency

FREE No Obligation Quote

ISO 27001 Information Security

Outcome-Focused Approach

Transparency is Guaranteed

Focus on Security

4.8/5 Rating on Clutch

Hire a Team of Your Choice

Costs Lower Than Your Local Guy

Leading Technology Partners and Achievements
With a history of excellence and innovation, we've been honored with several significant awards and partnered with leading technologies.


Frequently Asked Questions
Find answers to common questions about our services, process, and expertise.
The cost varies based on data sources, dashboard complexity, custom visuals, embedded analytics requirements, and integration scope. For an accurate quote tailored to your Power BI project, please get in touch with our experts.
