
Is Your Business AI-Ready?

Tech
 5 min read

If you run an e-commerce business, chances are your data is everywhere. Sales in one platform, stock levels in another, ad spend in a third tab you opened yesterday and never closed. It adds up quickly, and at some point, pulling a clear weekly picture starts taking longer than it should.
That is something we hear regularly from e-commerce owners. Not that they lack data, but that they cannot get to it quickly enough to act on it. Power BI, used alongside SharePoint Online, is one simple way to change that.
Most e-commerce platforms come with some reporting built in, and for a while, it is enough. You can see your sales, check your top products and get a rough sense of where traffic is coming from. That works well when things are fairly simple.
The problem comes when your business grows past that point. When you are selling across multiple channels, managing stock from different suppliers and trying to work out whether a promotion actually made money after all the costs are factored in, a standard dashboard starts showing its age.
Most teams fill the gap by cobbling things together. Someone exports a CSV, someone else maintains a spreadsheet, a manager copies numbers into a slide each week and it is not pretty, but it works until one version does not match another, and nobody is quite sure which one to trust.
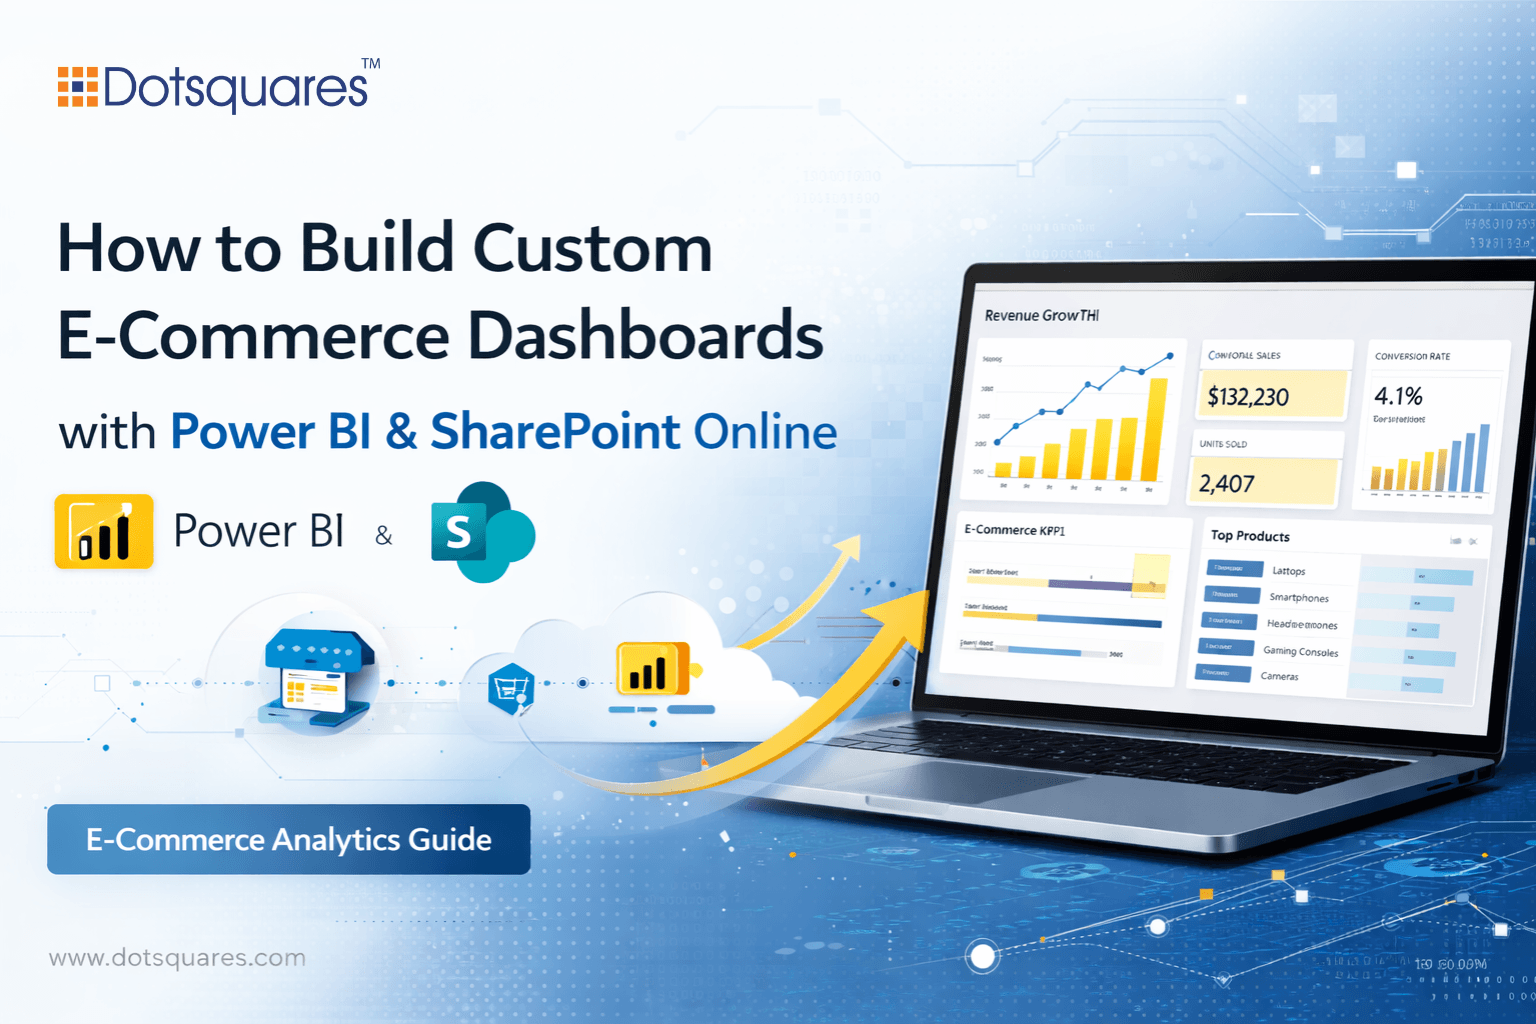
Power BI connects to the tools you are already using, Shopify, WooCommerce, Google Analytics, Meta Ads, Xero and your warehouse management system. Once these data sources are linked, the information updates on a schedule without anyone having to touch it.
And what you end up with is a custom e-commerce dashboard built around the questions your business actually needs to answer:
These are not things most built-in platforms will tell you cleanly, but Power BI can.
You decide which metrics matter to your operation, and the reports reflect that. Not the other way around.
Building a solid report is only half the job. The other half is making sure the right people can actually find it and use it without adding another tool to their already busy day.
SharePoint Online lets you embed Power BI reports directly into the pages your team already visits. Your operations lead opens their SharePoint page and sees fulfillment times and stock alerts. Your marketing person sees campaign performance. You see the full picture and all this works without anybody sending a request or waiting for a report to land in their inbox.
Because SharePoint dashboard integration sits within your existing Microsoft 365 setup, permissions are handled through the same system your IT team already manages. You are not building new access controls from scratch. It inherits what is already in place.
For businesses already on the Microsoft 365 stack, this combination is far less complicated to set up than most people expect.
Most e-commerce businesses need visibility on a few core things:
These are starting points, not a fixed list. The best dashboards grow out of conversations about what decisions you make regularly and what information would make those decisions faster or more confident.
The most common issue we come across has nothing to do with the technology. It is about definitions. When one system records a sale at checkout and another records it when the order ships and when a few numbers do not match, people start questioning everything the dashboard tells them, and then they stop using it.
Before you write a single Power BI report, it is worth sitting down and agreeing on what each metric actually means in your business. Which data source is the source of truth for revenue? How do you count a return? What qualifies as a completed order? It is unglamorous work, but it is what separates a dashboard people rely on from one that quietly gets abandoned.
Starting small helps too. Pick the two or three reports your team looks at every single week. Get those working well and trusted. Build from there. Trying to launch thirty reports on day one is how you end up with a dashboard nobody uses.
There is a better way to run your reporting, and it does not require a big IT overhaul. We work with e-commerce businesses to build Power BI dashboards and SharePoint setups that fit how they actually operate. Clean data, clear reports, and no more spreadsheet archaeology on a Friday afternoon.
Get in touch with our team at Dotsquares for sharepoint development and let us show you what your reporting could look like.

Discover how DevOps deployment automation, CI/CD pipelines, and Infrastructure as Code help businesses reduce software deployment time by up to 80% while improving quality and reliability.
Keep Reading
Discover the top reasons AI implementation fails and learn seven common mistakes businesses should avoid to improve adoption, ROI, and long-term AI success.
Keep Reading
Explore the Lovable Pricing Guide 2026 with detailed plan comparisons, pricing, pros, cons, features, and the best alternatives.
Keep Reading